Leaderboard
.thumb.png.a43579d9e280a5c4c80807bf93412ae7.png)


Popular Content
Showing content with the highest reputation on 10/29/2018 in all areas
-
Been without a computer for 2 years. Had to save money to buy one But now I am back...4 points
-
@Andres ZeroCross, I believe you have outdated Lilu SDK. @nms, sure, releases need thorough testing, and we try to release things simultaneously and not very often to avoid people having to upgrade many times. The next update will have to arrive close to 10.14.1, as there are certain breaking issues. The reason we do not hurry at present is that 10.14.0 works fine, and we still want to at least try to land some important changes in the current release.3 points
-
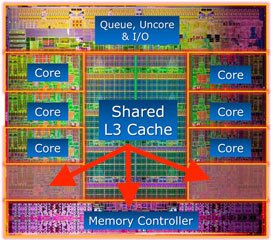
No. It should not be moved. Memory controller is in a CPU.2 points
-
Memory controller Power. It should not be moved. Memory controller is in a CPU.2 points
-
Si ho visto che molti hanno lo stesso mio problema. Credo sia una combo di bugs tra Clover whateverGreen Una soluzione prima o poi la troveremo Per ora grazie per la pazienza e la tenacia che avete dimostrato2 points
-
SMC emulator with 2nd generation SMC support. Includes some monitoring plugins as API usage examples. New plugin additions are very welcome, given that they are well-written. Source code: repository. FAQ and documentation: link. Features and configuration: link. I wish to express my deep gratitude to all the people who worked on this project with me.1 point
-
"Core Frequencies" = "Частоты ядер"; // CPU frequencies sub group "Core Temperatures" = "Температуры ядер"; // CPU temperature sub group "Temperature" = "Температура"; // singular "Temperatures" = "Темературы"; // plural "Frequency" = "Частота"; // singular "Frequencies" = "Частоты"; // plural "Multipliers" = "Множители"; "Voltage" = "Напряжение"; // singular "Voltages" = "Напряжения"; // plural "Amperage" = "Ток"; "Fans or Pumps" = "Вентиляторы и помпы"; "Batteries" = "Батареи"; "Media health" = "Целостность дисков"; "Life" = "Жизнь"; // hdd/ssd life // Intel Power Gadget "Intel® Power Gadget info" = "Intel® Power Gadget info"; // will be a sub group "DRAM" = "ОЗУ"; // Intel Power Gadget "Package Temperature" = "Температура пакета"; // Intel Power Gadget "Package Power Limit (TDP)" = "Термопакет"; // Intel Power Gadget "Max Temperature" = "Максимальная температура"; // Intel Power Gadget "Thresholds" = "Пороги"; // Intel Power Gadget "Base Frequency" = "Базовая частота"; // Intel Power Gadget "GPUs" = "Графика"; // GPU, when taken from PerformanceStatistics "Core Clock" = "Частота ядра"; //GPU, when taken from PerformanceStatistics "Fan/Pump Speed" = "Скорость вентилятора"; //GPU, when taken from PerformanceStatistics "Fan/Pump Speed rate" = "Использование вентилятора"; //GPU, when taken from PerformanceStatistics "Utilization" = "Использование"; //GPU, when taken from PerformanceStatistics "Activity" = "Активность"; //GPU, when taken from PerformanceStatistics "Core Utilization" = "Использование ядра"; // GPU, when taken from PerformanceStatistics "Device Unit %d Utilization" = "Использование устройства %d"; // GPU, when taken from PerformanceStatistics "Video Engine Utilization" = "Использование видеодвижка"; // GPU, when taken from PerformanceStatistics "Used VRAM" = "Использовано Видео-ОЗУ"; // GPU, when taken from PerformanceStatistics "Free VRAM" = "Свободно Видео-ОЗУ"; // GPU, when taken from PerformanceStatistics "Total" = "Всего"; // RAM "Active" = "Активная"; // RAM "Inactive" = "Неактивная"; // RAM "Free" = "Свободная"; // RAM "Used" = "Используемая"; // RAM "Purgeable" = "Очищаемая";// RAM "Wired" = "Связанная"; // RAM "Proximity" = "Датчик"; // CPU or GPU "Heatsink" = "Радиатор"; // CPU or GPU "Motherboard" = "Материнская плата"; "DIMM 0" = "Модуль ОЗУ 0"; // RAM "DIMM 1" = "Модуль ОЗУ 1"; // RAM "Ambient" = "Корпус"; // Motherboard "GPU %d Board" = "ГПУ %d плата"; "GPU %d Proximity" = "ГПУ %d оценка"; "Core %d" = "Ядро %d"; // CPU or GPU "Diode %d" = "Датчик %d"; // CPU or GPU "CPU %d" = "ЦПУ %d"; "GPU %d Core" = "ГПУ %d ядро"; "GPU %d Shaders" = "ГПУ %d шейдеры"; "GPU %d Memory" = "ГПУ %d память"; "GPU %d Voltage" = "ГПУ %d напряжение"; "Core %d Multiplier" = "Ядро %d множитель"; "Package Multiplier" = "Пакетный множитель"; // Motherboard's: "VRM Voltage" = "Напряжение VRM"; "DIMM Voltage" = "Напряжение ОЗУ"; "+12V Bus Voltage" = "Напряжение +12В"; "+5V Bus Voltage" = "Напряжение +5В"; "-12V Bus Voltage" = "Напряжение -12В"; "-5V Bus Voltage" = "Напряжение -5В"; "3.3 VCC Voltage" = "Напряжение 3.3В VCC"; "3.3 VSB Voltage" = "Напряжение 3.3В VSB"; "3.3 AVCC Voltage" = "Напряжение 3.3В AVCC"; "Fan %d" = "Вентилятор %d"; "log copied to clip board!" = "журнал скопирован в буфер обмена!";1 point
-
are you trying to patch the onboard 10g ports? This is way easier and no patching required! Just place The FakePCIID kexts in /EFI/Clover/kexts/Other and SmallTreeIntel9259x in /EFI/Clover/Kexts/10.13 or 10.14 if you're on mojave. Intel X550-AT2 Drivers.zip1 point
-
On #2 in HWMonitorSMC2 it shows, but I cannot tell correctly or not correctly. Therefore it is better to conform to the rules Intel.1 point
-
Intel Power Gadget.app have a minimum of 50 milli senconds to 1000 millisenconds (i.e 1 second) HWMonitorSMC2.app have a minimum of 100 milliseconds up to 10000 milliseconds (i.e. 10 seconds) Why? HWMonitorSMC2.app show you also the rest of the PC sensors and so I decide to not go less then 100 milliseconds otherwise all will becomes really heavy. Setting it to 1 second will be the same of 1000 milliseconds in Intel Power Gadget.app (for example). 0.5 seconds in HWMonitorSMC2.app is the same of setting 500 milliseconds in IPG.app and so on. Is what I've already said here So should I follow the rules from Intel?1 point
-
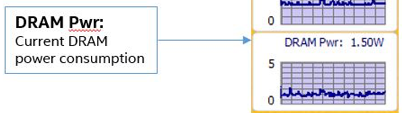
ctich is right. It DRAM Power. (Current DRAM power consumption.) Then it is necessary to move in RAM group. https://software.intel.com/en-us/articles/intel-power-gadget-20 My #1 shows DRAM in IPG. My #2 not shows DRAM in IPG.
 1 point
 -
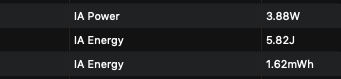
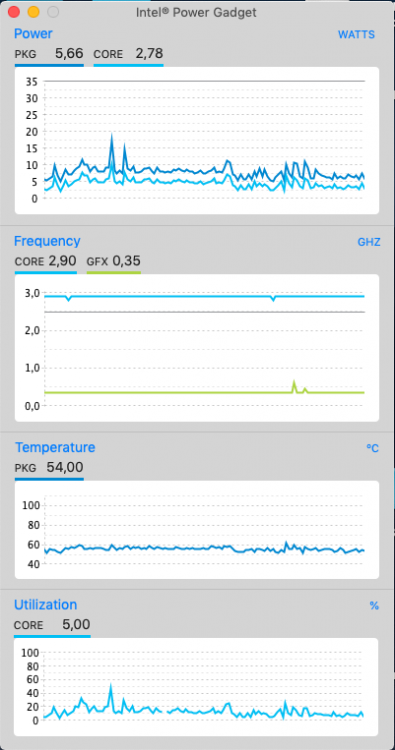
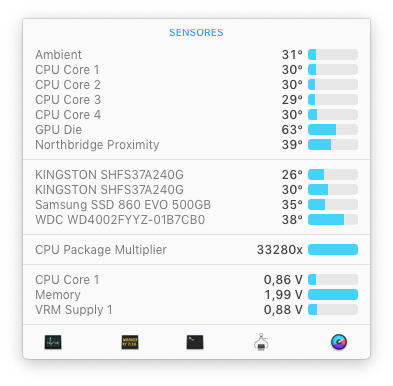
Guys there's a problem. Until now I didn't use a check if the IntelPowerGadget.framework can return Power stuff like these: The function provided is this: // Returns true if we have platform energy MSRs available bool IsDramEnergyAvailable(); The fact is one. For me the Intel Power Gadget.app from Intel did not show the DRAM stuff, see the below picture: ... and infact IsDramEnergyAvailable() returns false. If I do things correctly HWMonitorSMC2.app will stop showing them for CPUs that should not show these values. What to say? DRAM (i.e IA Power and IA Energy) show up correctly if I don't use this check. If I leave it there are twho possibilities: false information as Intel says not supported. possible crashes that for unknown reasons did not happen to me but that can happen for someone else System What to do then? This is ctich screen shot. see the difference: Ok then.
 1 point
 -
DRAM shows the power consumption of RAM at the moment(these readings depend on the performance profile in BIOS.). It must be renamed to DRAM to match IPG.1 point
-
T420 2420M 8Go 1600*900 bought must received it wednesday my previous was 2440M 4Go 1366*768 i'm back soon :-)1 point
-
Should I move it under "RAM"?1 point
-
Welcome back Andy1 point
-
Hi ctich, the name of this key returned by IntelPowerGadget.framework just says "IA Power" and from what I know DRAM usually stands for "Dynamic Random Access Memory", truly unequivocal. If that is related to memories (RAM) I'll be happy to add these keys under the "RAM" group. Let me know.
 1 point
 -
@DMFabio ti ho preparato efi completa.. quel config con il tema di tonymanero nun se poteva vedè EFI_Gigabyte GA-B250M-D2V 2.zip1 point
-
non installare kext in S/L/E puoi tenerli in EFI Buona regola: mai tenere kext doppi, causano molti problemi1 point
-
Strano ioreg è ok.. il dsdt è ok riguardo al trackpad Lascia solo VodooI2C+VoodooI2CElan+VoodooI2CHID rimuovi: VoodooI2CFTE.kext VoodooI2CUPDDEngine.kext1 point
-
@darkbluecode Sostituisci dsdt e config riavvia posta ioreg darkbluecode.zip1 point
-
Ok...guardo il tutto1 point
-
Indeed, enabling CSM in BIOS did the trick! Thank you so much, @MaLd0n!1 point
-
Allega ioreg e la efi1 point
-
Partito, grazie mille1 point
-
VGTab seems to have some bug. Out of curiosity I tried using a Windows PowerPlay Table and manually adjusted the VGTab generated fan speed and temperature values, leaving the rest default. Fan control now works much better. The delay for the fan spin is gone and fans spin down much faster. The fan control now behaves as it does on Windows. I will keep playing around with this and release some PowerPlay Tables to test once I am done.1 point
-
First things first, do you have access to a Mac or hack to download macOS and create the install media? What have you tried? I see no mention of graphics card so using onboard? Intel? What version? Sent from my iPhone using Tapatalk1 point
-
Yes i know, the real macbook has same problem. Sometimes need plug off and plug in your charger kan solve the problem. And with APFS of format system, battery indicator will has same problem to with acpibatterymanager.kext with certain device. Need to modify "AcpiPollDelay". Sorry for bad english Sent from my Mi Note 2 using Tapatalk1 point
-
@fallen00sniper Boot loop - it is very strange. Could you temporarily move AirPortBrcmNIC.kext from /S/L/E/IO812Family.kext/Contents/Plugin into ~/Desktop and try to boot? And after - put it back and move /S/L/E/AirPortBrcmNIC-MFG.kext into ~/Desktop and try to boot again?1 point
-
will look1 point
-
I think it related to "ACPIPollDelay". To prove it, try to plug off charger dan plug in again. If battery indicator show then ACPIPollDelay problem Sent from my Mi Note 2 using Tapatalk1 point
-
+1 On my ONDA V919 CoreM it have same problem with you. With SMCBatteryManager then it show no battery but with ACPIBatteryManager by RehabMan it works fine. I have already patched the dsdt.1 point
-
Mojave removed support of HD 3000 Graphics , you need to copy the hd3000 kexts to /S/L/E , and than rebuild caches1 point
-
OK, based on your IOReg, you do not have a BT device connected via USB. Does it show up in System Information under the USB section? I'm guessing that it doesn't and that this is a USB issue. I also am wondering if you have 2 different Nvram.plists - one for each Clover installation. That might be screwing things up. I know you say that you have USB working perfectly but are you sure that all of your internal USB ports are working correctly. Is your webcam working ok? Do you have any other internal USB devices? If the BT kexts are installed correctly and you still can't get BT working, it is likely either a USB issue or a firmware issue. Do you have a Windows installation? Does BT work in Windows? If you boot to Mojave right after booting to Windows might your BT load? Check that out and let me know.1 point
-
Yeah I do, it won't work without it. Asus change the vendor from Intel, changing that won't affect anything except maybe drivers under windows. its X550 Thats the plan, patch just one port and see what happens and if all goes well the second one.1 point
-
@Balamut, there was still an error in the two commands, please see revised post above!1 point
-
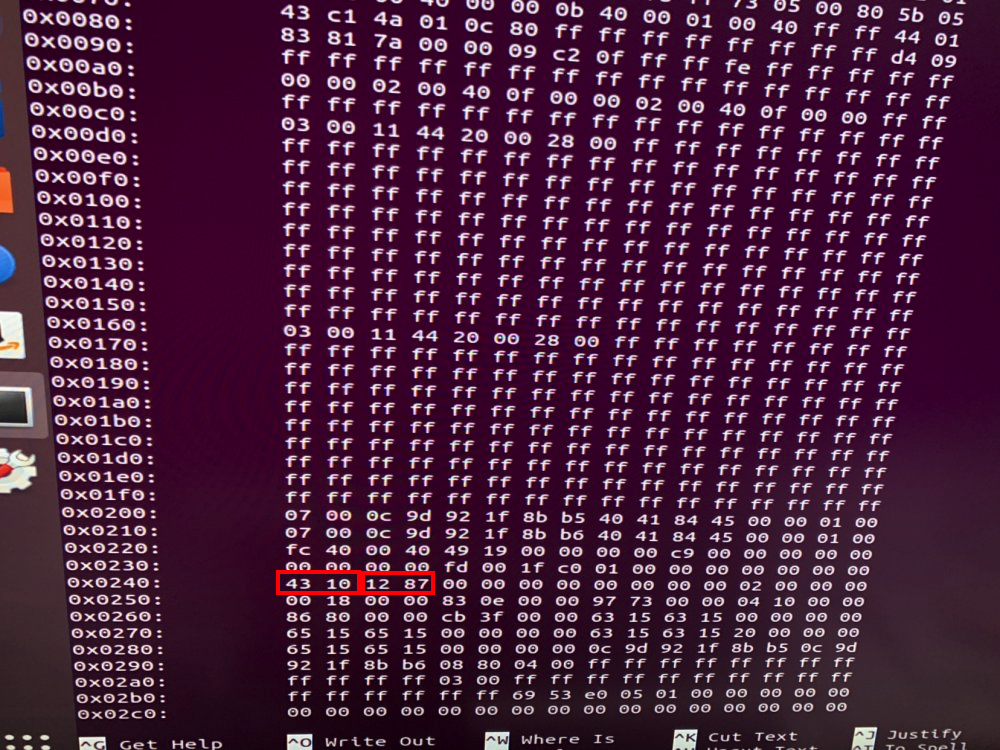
controller figures as 1043 instead of 8086, thus at your own risk... I also miss an ifconfig screenshot but from the other screenshot above I guess your 10g ports are assigned to enp179s0f1? sudo ethtool -E enp179s0f1 magic 0x15638086 offset 0x242 value 0x0a sudo ethtool -E enp179s0f1 magic 0x15638086 offset 0x243 value 0x00 Good luck..
 1 point
 -
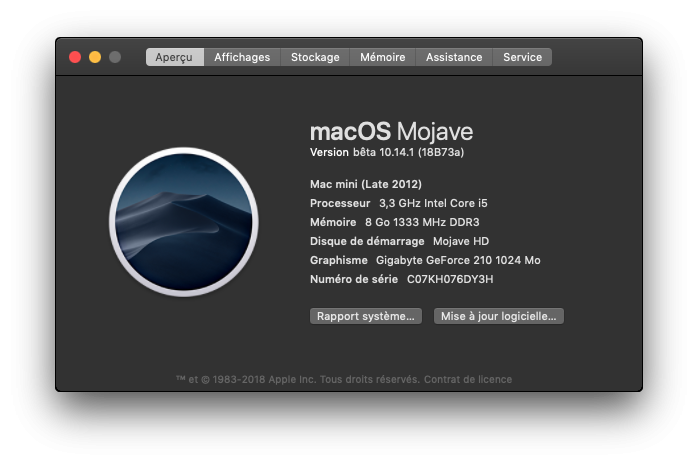
Gigabyte GeForce 210 works great like previous macOS Mojave here Update / Reboot No kext change
 1 point
 -
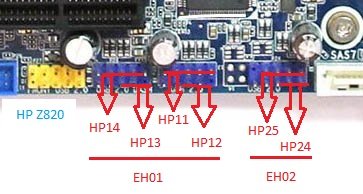
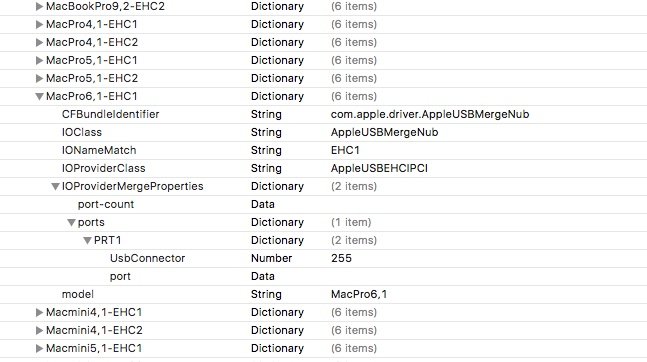
Here is internal port mapping for Z820. Please note that port HP11 overlapped by PRT1. PRT1 defined here for our "MacPro6,1" : /System/Library/Extensions/IOUSBHostFamily.kext/Contents/PlugIns/AppleUSBEHCIPCI.kext/Contents/Info.plist
 1 point
 -
Good to have. Well, the second picture makes it very clear. XNU kernel invokes APTIO RuntimeServices SetVariable code, and then this code never returns. What we have in SetVariable is the following code coming from NvramDxe, I can tell that it did not change anyhow since the source leak, and the one in the source leaks are known to work. The code relevant to SMM switching looks the same too, and EFI_SMM_COMMUNICATION_PROTOCOL implementation is provided by EDK2. They still allocate the SMM communication buffer as EfiRuntimeServicesData, and still pass its address via NvramMailbox NVRAM variable, so it should be guarded by AptioMemoryFix. As a result I believe that the infinite loop happens somewhere on the way to NvramSmm (which now represents former Smi and Smm code glued together). However, the brief checking of the binary and the source shows that the Smi handler (NvramSmmCommunicationHandler, SetVariableSmmHandler) is pretty much the same too. This leaves us in an uneasy situation, where we do not know where to look for the problem. What I could suggest is writing a EFI runtime driver (by ripping off the known APTIO V source) that will reimplement communication with SMM: 1. Allocate a new communication buffer. 2. Check & overwrite the address of the old communication buffer in MailBox variable 3. Overwrite EFI_RUNTIME_SERVICES Variable functions with APTIO code but the new communication buffer. The above will result in having a complete path prior to SMM code under our control. Afterwards we should be able to get this code fully functional on some working APTIO V system (e.g. Skylake or Kaby Lake), and try it on the new problematic system. By changing the logic via the return codes it should be easy to ensure where the issue is: DXE or SMM driver. Other than it may even help us to understand whether the SMI handler exists at all. If it is SMM, I would probably try replacing NvramSmm with NvramSmm & NvramSmi from some Z370 BIOS first and reflashing the firmware. Then… perhaps reverse-engineer/reimplement NvramSmm with the new changes and try to debug it too. If you like the idea, I can share APTIO src and let you proceed.1 point
-
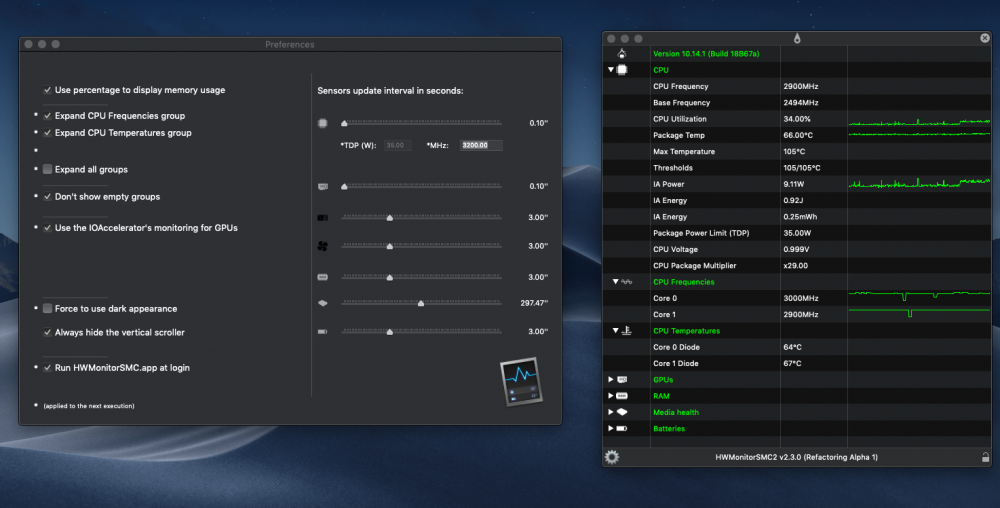
This time was a lot of work, and I almost rewrite it. Implemented graphs using a modified version by me of CorePlot.framenwork. To activate the graph right click and push the button at bottom of the log (green activated, grayed inactive.. not present? you cannot add the plot). I didn't expect every thing to be perfect now because not all the sensors are ready to show them. The smc parser is now written in swift (SMCKit totally reworked by me to work with our hacks). In fact you can now found also the dump of your smc keys to the complete log (right click on the header). I've reordered everithings (e.g.) cpu things are now inside a single group and long stuff like single core temperatures and frequencies are inside two separated sub group. The same for gpu/igpu related things and others. The app try now to ordinate sensors coming from the smc, the IOAccelerator and the Intel Power Gadget (and to removing redundant sensors that do the same job... IPG takes the precedence if you have it installed). Each main group have now its own polling timer that you can change in real time. In almost all of them you can now set a time interval between 100 milliseconds/10 seconds, less on the media group that has a selectable range of 1 second/600 seconds. The app should recognize systems with two Xeon processors and add the relative sensors. But need a confirmation. In the below picture you can see two fields, why? They are just for the graphs because it need to know the max Y coordinate to show a frequency line that didn't excede the frame of the view. The TDP is automatically set when Intel Power Gadget is installed, otherwise it will be 100W and needs an udjustment by hand. The frequency in MHz is the max frequency of the CPU in turbo boost... that I cannot calculate so the default value is your CPU base frequency. As for the TDP's field the purpose is to have a good graph. See below: Thanks to @iParzival for the new icon set. Should be nice if you show me pictures of the new "Motherboard"/"Fans" groups from both hack and real Macs. The parser is new and should be able to show you some voltages. About Fans, should show you the fan name (as before), the current speed but also the min and the max speed. We are talking about motherboard Fans. GPUs fans are only displayed in the "GPUs" group but only when available and published by the driver.... unless you where adding them using the acpi methods. Let me know, just hope not to much crashes to fix. P.S. New translations will be needed, but that is actually secondary. Due to a bug you may need this version of IntelCPUMonitor.kext (if you will) that for +15-core-CPUs is able to produce the exceded good single core frequencies keys. Will not work (entirely) with the sf one... until I'll made a commit that require me to finish this new app to be able to read these keys (otherwise the stable one can't). P.S 2. Adding a graph for each sensor is anyway not efficent, in fact on a mobile laptop you will see cpu utilization increasing (3/4 %) due to the greater resources of the system to run all animations. This increase again too much if the time interval is in milliseconds instead of seconds. HWMonitorSMC2.app_v2.3.0_refactoring_alpha1.zip
 1 point
 -
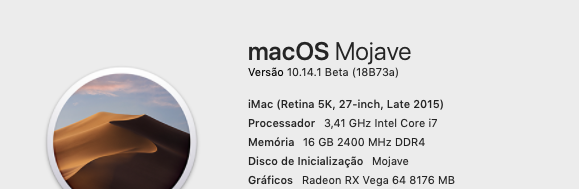
If you using GM Mojave final - in my opinion is not good for Vega Cards...maybe you need try use betas developers program ... if you want post your config.plist I will inject for you test (hide your serial number SMBIOS) "Fan Speed(%)"=22 "Core Clock(MHz)"=132 "Memory Clock(MHz)"=500 "Fan Speed(RPM)"=1125 "Temperature(C)"=60 Im using little bit more quiet fan ...
 1 point
 -
And you and I have similar converters! Apogee FTW!
 1 point
 -
Try this, if it works you will need to change the clover graphics settings after you are in Sierra. Mouint EFi and open config.plist remove nv_disable=1 in boot options and add Inject Nvidia in graphics section. EFI.zip1 point
-
your gpu is not serported for a Mojave install. install high Sierra till web driver is released1 point
-
Here is my original method "translated" into an AppleScript so anyone can put it on Automator and it will do the trick switching between a full translucent "dark mode" and a semi-translucent "light mode": tell application "System Events" tell appearance preferences if dark mode is false then set dark mode to true do shell script "defaults write com.apple.universalaccess reduceTransparency -bool false" do shell script "killall Finder" do shell script "killall Dock" do shell script "killall NotificationCenter" do shell script "killall Spotlight" else set dark mode to false do shell script "defaults write com.apple.universalaccess reduceTransparency -bool true" do shell script "killall Finder" do shell script "killall Spotlight" end if end tell end tell Here is the Applescript already-ready to download: hybrid dark light switch.zip1 point
-
Yes, on most desktop Mobos when using 2 cards you drop from 16 PCIE lanes for the single card to 8 lanes for each card. Since Geekbench or other open GL apps only read one card its only 8 lanes do performance drops a bit. The same happens in Uningine and Cinebench for me. Some Xeon chip mobos have more pie lanes for 16 on each card.1 point